Ranking Report Using Shapes...
Remember that post on Bar Chart Using Shapes? Well, here's another use for those Rectangles. This report does Ranking across four quarters; you get to pick which quarters, and adjusts the shapes accordingly.
Remember that post on Bar Chart Using Shapes? Well, here's another use for those Rectangles. This report does Ranking across four quarters; you get to pick which quarters, and adjusts the shapes accordingly.
The difficult I do immediately, the impossible takes a little bit longer.


Reports
| Tips (Main) |
| Home |
Private Sub Detail_Format(Cancel As Integer, FormatCount As Integer)
On Error Resume Next

    shpBar1.Width = Nz(Me.txt1, 0) * (1440 * 1.125)
    shpBar2.Width = Nz(Me.txt2, 0) * (1440 * 1.125)
    shpBar3.Width = Nz(Me.txt3, 0) * (1440 * 1.125)
    shpBar4.Width = Nz(Me.txt4, 0) * (1440 * 1.125)

    If Me.txtShowHospital = False Then
        Me.txtHospitalName.Visible = False
    Else
        Me.txtHospitalName.Visible = True
    End If

End Sub
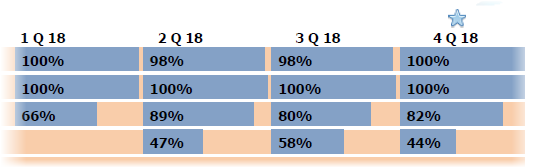
To create place four Rectangles on a continuous Report and name them shpBar1, shpBar2, shpBar3 and shpBar4. Then place Text Boxes on top of the Shapes and name them txt1, txt2, txt3, txt4. When creating your crosstab query use Column Names 1, 2, 3, 4 and use as the Control Source for the Text Controls.
Once done, copy the code between Private Sub Detail_Format(Cancel As Integer, FormatCount As Integer) and End Sub into the Detail section On_Format Event Procedure of the Report.
Once done, copy the code between Private Sub Detail_Format(Cancel As Integer, FormatCount As Integer) and End Sub into the Detail section On_Format Event Procedure of the Report.